Unified Observability: How Centralized Logging and Synthetic Monitoring Elevate DevOps Success
1/7/2025 • VirtueCloud
Introduction
In the fast-paced world of DevOps, ensuring smooth system performance is critical. This is where logging and monitoring come into play—they’re the backbone of a reliable, high-performing system. Logging helps capture system events, while monitoring tracks the health and performance of your infrastructure in real-time. For DevOps teams, centralized logging and synthetic monitoring are essential practices for efficient troubleshooting, performance optimization, and maintaining system reliability.
In this blog, we’ll explore these concepts in detail, focusing on their importance in DevOps pipelines and how they can drive efficiency across development and operations.
Why Monitoring and Logging are Essential
Monitoring and logging aren’t optional—they’re essential. Here’s why:
- Spot Issues Before They Impact Users: Real-time metrics like CPU usage, memory, and response times help identify issues proactively.
- Speed Up Troubleshooting: Centralized logging consolidates logs into one location, simplifying problem identification and resolution.
- Optimize Performance: Monitoring helps allocate resources efficiently and prevent bottlenecks.
- Enhance Collaboration: Shared logs improve team communication and problem-solving speed.
- Strengthen Security: Logs detect unauthorized access and track system changes for better compliance.
What is Logging?
Logging involves capturing events, actions, and error messages from systems, applications, and services. Logs are crucial for tracking system behavior, troubleshooting issues, and improving performance.
Types of Logs in DevOps:
- Application Logs: Track errors, transactions, and user interactions.
- Server Logs: Document server events, operations, and errors.
- Error Logs: Focus on system crashes or unhandled exceptions.
- Access Logs: Record user activity, login attempts, and resource access.
- Security Logs: Track security events and unauthorized access attempts.
Traditional Logging vs. Centralized Logging
In traditional systems, logs were collected per service or server, which worked for monolithic architectures. However, modern microservices architectures demand Centralized Logging, where logs from multiple services are aggregated into one platform.
Example: An online store’s payment and inventory services may operate independently. Without centralized logging, issues in the inventory service might be missed while troubleshooting payment failures.
Centralized Logging Benefits:
- Unified log visibility
- Faster troubleshooting
- Simplified analysis
- Improved scalability
Understanding Centralized Logging in DevOps
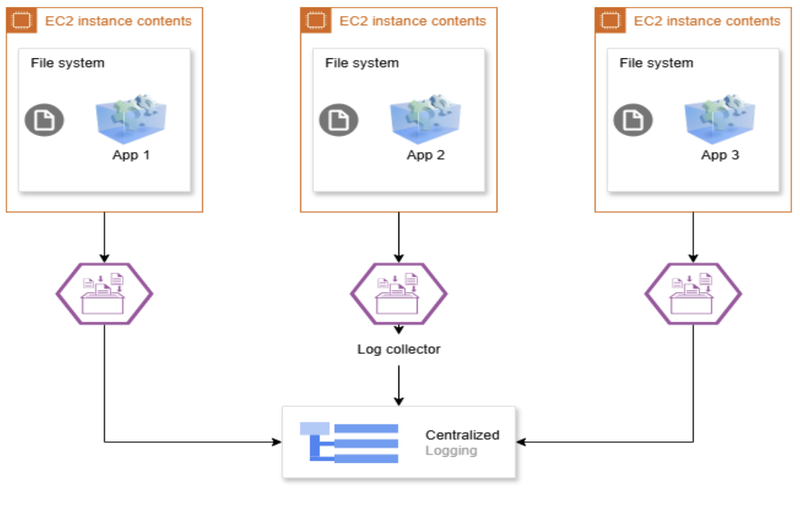
Centralized logging collects logs from various sources (applications, servers, databases) into a single platform, enabling better search, analysis, and monitoring.
How it Works:
- Log Creation: Systems generate logs.
- Log Collection: Tools like Logstash or Fluentd aggregate logs.
- Log Storage: Logs are stored in systems like ELK Stack or Splunk.
- Log Analysis: Logs are analyzed for patterns and issues.
- Alerts: Real-time alerts flag anomalies.
Why It’s Important:
- Unified visibility across services
- Faster issue resolution
- Scalable with infrastructure growth
- Enhanced security and compliance
What is Monitoring?
Monitoring in DevOps tracks system and application performance using metrics like CPU usage, response times, and uptime to ensure system reliability and early issue detection.
Types of Monitoring in DevOps:
- Infrastructure Monitoring: Tracks servers, virtual machines, and storage performance.
- Network Monitoring: Observes bandwidth, latency, and firewall performance.
- Application Performance Monitoring (APM): Tracks API response times, database health, and user interactions.
- Synthetic Monitoring: Simulates user interactions to detect issues proactively.
Synthetic Monitoring: Proactive System Health Checks
What is Synthetic Monitoring?
Synthetic monitoring uses automated scripts and virtual “bots” to simulate real user interactions, testing performance across your application or website.
How It Works:
- Create Test Scenarios: Define actions bots will simulate (e.g., login, add items to cart).
- Execute Tests: Perform tests at regular intervals.
- Collect Metrics: Analyze page load times, API response, and uptime.
- Trigger Alerts: Notify teams of any failures or anomalies.
Types of Synthetic Monitoring:
- Transaction Monitoring: Simulates end-to-end user journeys.
- Uptime Monitoring: Checks website availability.
- Performance Monitoring: Tracks page load and latency.
- API Monitoring: Ensures API reliability and performance.
Why It’s Important:
- Detects issues before users are affected
- Prevents downtime and ensures consistent performance
- Reduces operational costs through proactive fixes
Monitoring Metrics for Effective System Management
To ensure reliable system performance, track these key metrics:
- CPU Usage: Prevent resource bottlenecks.
- Memory Utilization: Avoid crashes due to memory exhaustion.
- API Response Time: Ensure smooth interactions between services.
- Uptime: Maintain service availability.
- Error Rate: Identify recurring issues and fix them promptly.
Conclusion
Centralized logging and synthetic monitoring are not just tools but essential practices in a modern DevOps workflow. Centralized logging ensures better visibility across distributed systems, while synthetic monitoring proactively detects performance issues. Together, they enable DevOps teams to build robust, reliable, and efficient systems.
By integrating these practices into your DevOps pipeline, you can ensure smooth deployments, reduced downtime, and an enhanced user experience.
Also Read
Related articles you might find interesting
Ingress Got You This Far — A Field Guide to Gateway API & HTTPRoute
Why platform teams are re-routing north-south traffic through the Kubernetes Gateway API, what HTTPRoute changes on the ground, and how to migrate without a big-bang rewrite.
AWS Graviton: High-Performance Compute with Energy Efficiency and Cost Savings
Automated ECS Deployment: Fargate or EC2, Make it easy with VirtueCloud
Hassle-Free ECS: Terraform Automation + CI/CD Pipeline